
Right of access to public information. December 2017
Right of access: number of requests
Requests for access to public information: 11.316.

It provides the total accumulated data of requests for access to public information processed through the Transparency Portal.
Data as of December 31, 2017. Source: GESAT (application for access request management).
Right of access: information on how to submit requests for access to public information
How do they ask us?
| Type of submission of access requests | Number of applications | Percentage over the total |
|---|---|---|
|
Electronic access - Cl@ve |
9,896 |
87.45% |
|
Access on paper |
1.420 |
12.55% |
|
Total |
11.316 |
100% |
-
Type of submission of access requests
-
Electronic access - Cl@ve
-
Number of applications
9,896
-
Percentage over the total
87.45%
-
-
Type of submission of access requests
-
Access on paper
-
Number of applications
1.420
-
Percentage over the total
12.55%
-
-
Type of submission of access requests
-
Total
-
Number of applications
11.316
-
Percentage over the total
100%
-

Compare the two possible ways of exercising this right: electronically (Cl@ve) or through paper applications.
Data as of December 31, 2017. Source: GESAT (application for access request management).
Right of access: records processing data
How do we process it?
Requests for access to public information: 11.316
| Status of processing of the file | Number of applications | Percentage over the total |
|---|---|---|
|
Completed dossiers |
10.412 |
92.01% |
|
Dossiers under processing |
872 |
7.71% |
|
Dossiers in administrative silence |
32 |
0.28% |
|
Total requests for the right of access |
11.316 |
100% |
-
Status of processing of the file
-
Completed dossiers
-
Number of applications
10.412
-
Percentage over the total
92.01%
-
-
Status of processing of the file
-
Dossiers under processing
-
Number of applications
872
-
Percentage over the total
7.71%
-
-
Status of processing of the file
-
Dossiers in administrative silence
-
Number of applications
32
-
Percentage over the total
0.28%
-
-
Status of processing of the file
-
Total requests for the right of access
-
Number of applications
11.316
-
Percentage over the total
100%
-
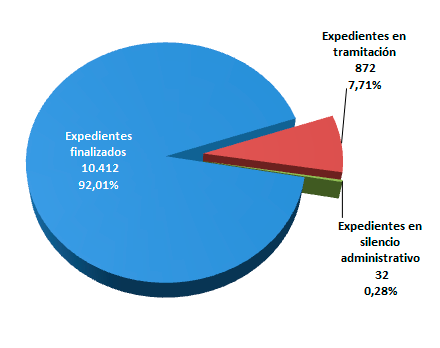
It includes the overall number of requests made by users as well as the status of processing of the same according to a triple classification: completed files, files in processing and files in administrative silence, comparing by percentage those categories.
Data as of December 31, 2017. Source: GESAT (application for access request management).
Right of access: data of resolution type
How do we solve it?
Requests for access to public information: 11.316
Completed Dossiers: 10.412 (92.01%)
| Types of resolution | Number of applications | Percentage |
|---|---|---|
|
Concession |
7.015 |
67.37% |
|
Inadmission |
2,460 |
23.63% |
|
Denial |
339 |
3.26% |
|
Withdrawal and other forms of termination |
598 |
5.74% |
|
Total completed dossiers |
10.412 |
100% |
-
Types of resolution
-
Concession
-
Number of applications
7.015
-
Percentage
67.37%
-
-
Types of resolution
-
Inadmission
-
Number of applications
2,460
-
Percentage
23.63%
-
-
Types of resolution
-
Denial
-
Number of applications
339
-
Percentage
3.26%
-
-
Types of resolution
-
Withdrawal and other forms of termination
-
Number of applications
598
-
Percentage
5.74%
-
-
Types of resolution
-
Total completed dossiers
-
Number of applications
10.412
-
Percentage
100%
-
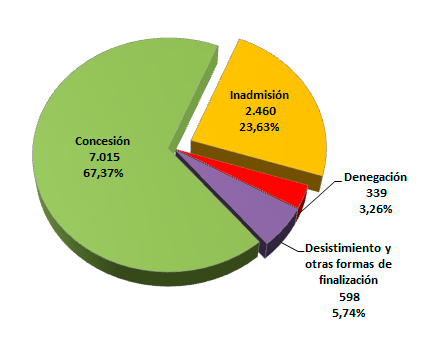
It indicates, in relation to the total of completed files, the result of the administrative resolutions according to the classification established by Law 19/2013, of 9 December. This classifies and compares with each other, by percentage, the requests for access to public information within the General Administration of the State according to the result of the resolution, that is: concessions; inadmissions; denials; withdrawal and other forms of termination.
Data as of December 31, 2017. Source: GESAT (application for access request management).
Distribution of requests among Transparency Information Units (ITUs)
Who are they asking?
| Transparency Information Unit | No. Applications | Percentage |
|---|---|---|
|
ITU Interior |
1,959 |
17.31% |
|
ITU Finance and Public Service |
1,895 |
16.75% |
|
ITU Development |
1,333 |
11.78% |
|
ITU Ministry of the Presidency and for Territorial Administrations - Presidency of the Government |
742 |
6.56% |
|
UITS Social Security |
621 |
5.49% |
|
ITU Education, Culture and Sport |
597 |
5.28% |
|
ITU Justice |
571 |
5.05% |
|
ITU Agriculture and Fisheries, Food and the Environment |
568 |
5.02% |
|
ITU Health, Social Services and Equality |
515 |
4.55% |
|
ITU Energy, Tourism and the Digital Agenda |
489 |
4.32% |
|
ITU Employment and Social Security |
483 |
4.27% |
|
ITU Economy, Industry and Competitiveness |
457 |
4.04% |
|
ITU Defence |
392 |
3.46% |
|
ITU Foreign Affairs and Cooperation |
298 |
2.63% |
|
Royal House |
265 |
2.34% |
|
UITS Data Protection Agency |
131 |
1.16% |
|
Total |
11.316 |
100% |
-
Transparency Information Unit
-
ITU Interior
-
No. Applications
1,959
-
Percentage
17.31%
-
-
Transparency Information Unit
-
ITU Finance and Public Service
-
No. Applications
1,895
-
Percentage
16.75%
-
-
Transparency Information Unit
-
ITU Development
-
No. Applications
1,333
-
Percentage
11.78%
-
-
Transparency Information Unit
-
ITU Ministry of the Presidency and for Territorial Administrations - Presidency of the Government
-
No. Applications
742
-
Percentage
6.56%
-
-
Transparency Information Unit
-
UITS Social Security
-
No. Applications
621
-
Percentage
5.49%
-
-
Transparency Information Unit
-
ITU Education, Culture and Sport
-
No. Applications
597
-
Percentage
5.28%
-
-
Transparency Information Unit
-
ITU Justice
-
No. Applications
571
-
Percentage
5.05%
-
-
Transparency Information Unit
-
ITU Agriculture and Fisheries, Food and the Environment
-
No. Applications
568
-
Percentage
5.02%
-
-
Transparency Information Unit
-
ITU Health, Social Services and Equality
-
No. Applications
515
-
Percentage
4.55%
-
-
Transparency Information Unit
-
ITU Energy, Tourism and the Digital Agenda
-
No. Applications
489
-
Percentage
4.32%
-
-
Transparency Information Unit
-
ITU Employment and Social Security
-
No. Applications
483
-
Percentage
4.27%
-
-
Transparency Information Unit
-
ITU Economy, Industry and Competitiveness
-
No. Applications
457
-
Percentage
4.04%
-
-
Transparency Information Unit
-
ITU Defence
-
No. Applications
392
-
Percentage
3.46%
-
-
Transparency Information Unit
-
ITU Foreign Affairs and Cooperation
-
No. Applications
298
-
Percentage
2.63%
-
-
Transparency Information Unit
-
Royal House
-
No. Applications
265
-
Percentage
2.34%
-
-
Transparency Information Unit
-
UITS Data Protection Agency
-
No. Applications
131
-
Percentage
1.16%
-
-
Transparency Information Unit
-
Total
-
No. Applications
11.316
-
Percentage
100%
-
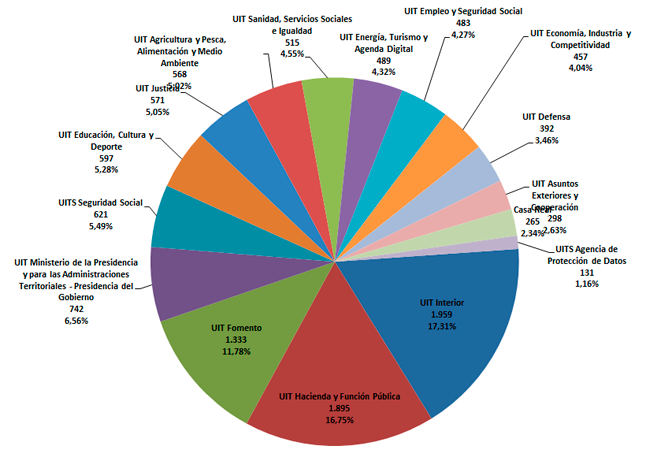
Data as of December 31, 2017, according to the new classification of management centers by UIT as a result of the approval of Royal Decree 424/2016, of November 11, which establishes the basic organic structure of ministerial departments.
Source: GESAT (application for access request management).
Thematic classification of applications: RISP
On what subject do they ask us?
| RISP Level 1 | Percentage |
|---|---|
|
Science and technology |
3.27% |
|
Commerce |
0.55% |
|
Culture and leisure |
1.26% |
|
Demography |
1.38% |
|
Sport |
0.61% |
|
Economy |
2.22% |
|
Education |
3.83% |
|
Employment |
1.81% |
|
Energy |
1.43% |
|
Hacienda |
8.21% |
|
Industry |
0.83% |
|
Legislation and justice |
5.42% |
|
Environment |
3.19% |
|
Rural environment and fishing |
0.91% |
|
Health |
3.10% |
|
Public sector |
30.56% |
|
Security |
11.51% |
|
Society and welfare |
4.00% |
|
Transport |
12.58% |
|
Tourism |
0.28% |
|
Urbanism and infrastructures |
2.73% |
|
Housing |
0.35% |
|
TOTAL |
100% |
-
RISP Level 1
-
Science and technology
-
Percentage
3.27%
-
-
RISP Level 1
-
Commerce
-
Percentage
0.55%
-
-
RISP Level 1
-
Culture and leisure
-
Percentage
1.26%
-
-
RISP Level 1
-
Demography
-
Percentage
1.38%
-
-
RISP Level 1
-
Sport
-
Percentage
0.61%
-
-
RISP Level 1
-
Economy
-
Percentage
2.22%
-
-
RISP Level 1
-
Education
-
Percentage
3.83%
-
-
RISP Level 1
-
Employment
-
Percentage
1.81%
-
-
RISP Level 1
-
Energy
-
Percentage
1.43%
-
-
RISP Level 1
-
Hacienda
-
Percentage
8.21%
-
-
RISP Level 1
-
Industry
-
Percentage
0.83%
-
-
RISP Level 1
-
Legislation and justice
-
Percentage
5.42%
-
-
RISP Level 1
-
Environment
-
Percentage
3.19%
-
-
RISP Level 1
-
Rural environment and fishing
-
Percentage
0.91%
-
-
RISP Level 1
-
Health
-
Percentage
3.10%
-
-
RISP Level 1
-
Public sector
-
Percentage
30.56%
-
-
RISP Level 1
-
Security
-
Percentage
11.51%
-
-
RISP Level 1
-
Society and welfare
-
Percentage
4.00%
-
-
RISP Level 1
-
Transport
-
Percentage
12.58%
-
-
RISP Level 1
-
Tourism
-
Percentage
0.28%
-
-
RISP Level 1
-
Urbanism and infrastructures
-
Percentage
2.73%
-
-
RISP Level 1
-
Housing
-
Percentage
0.35%
-
-
RISP Level 1
-
TOTAL
-
Percentage
100%
-
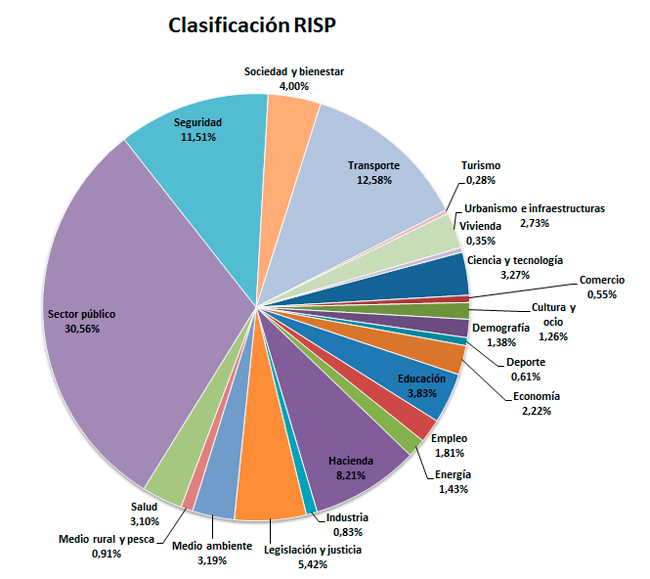
It shows the classification of requests for access rights according to the categories of Reuse of Public Sector Information (RISP), according to the standard created by the Public Information Catalog (datos.gob.es).
Data as of December 31, 2017. Source: GESAT (application for access request management).
Thematic classification of applications: categories of active advertising
What topic are you asking us about?
| Categories of Active Advertising | Percentage |
|---|---|
|
1.1.1 Functions. |
3.06% |
|
1.2.1 Organizational structure |
1.27% |
|
1.2.2 Professional profiles high positions and top managers |
0.92% |
|
1.3.1 Annual and multi-annual plans and programmes |
1.22% |
|
2.1 Guidelines, instructions, circulars |
1.34% |
|
2.2 Expedient resolutions |
1.93% |
|
2.3 Responses to queries raised by individuals or other bodies |
9.94% |
|
2.4 Normative projects |
2.11% |
|
2.5 Technical reports |
3.41% |
|
2.6 Other documentation |
4.19% |
|
3.1.1 Contracts and awards |
6.89% |
|
3.1.2 Minor contracts |
0.15% |
|
3.2.1 Partnership agreements |
1.03% |
|
3.2.2 Management assignments |
0.43% |
|
3.3.1 Subsidies and public aid granted |
3.33% |
|
3.4.1 Budgets |
2.63% |
|
3.4.2 Specific costs |
4.90% |
|
3.4.3 Financial and accounting control systems |
0.18% |
|
3.5.1 Remuneration of senior officials and top managers |
2.59% |
|
3.5.2 Good governance |
1.21% |
|
3.5.3 Employment relationships |
2.76% |
|
3.5.4 Remuneration of public employees |
3.80% |
|
3.5.5 Authorization or Recognition of Compatibility Decisions Affecting Public Employees |
0.42% |
|
3.6.1 Statistics activity |
7.17% |
|
3.7.1 Real property and real rights |
1.08% |
|
4 Other information |
32.04% |
|
TOTAL |
100% |
-
Categories of Active Advertising
-
1.1.1 Functions.
-
Percentage
3.06%
-
-
Categories of Active Advertising
-
1.2.1 Organizational structure
-
Percentage
1.27%
-
-
Categories of Active Advertising
-
1.2.2 Professional profiles high positions and top managers
-
Percentage
0.92%
-
-
Categories of Active Advertising
-
1.3.1 Annual and multi-annual plans and programmes
-
Percentage
1.22%
-
-
Categories of Active Advertising
-
2.1 Guidelines, instructions, circulars
-
Percentage
1.34%
-
-
Categories of Active Advertising
-
2.2 Expedient resolutions
-
Percentage
1.93%
-
-
Categories of Active Advertising
-
2.3 Responses to queries raised by individuals or other bodies
-
Percentage
9.94%
-
-
Categories of Active Advertising
-
2.4 Normative projects
-
Percentage
2.11%
-
-
Categories of Active Advertising
-
2.5 Technical reports
-
Percentage
3.41%
-
-
Categories of Active Advertising
-
2.6 Other documentation
-
Percentage
4.19%
-
-
Categories of Active Advertising
-
3.1.1 Contracts and awards
-
Percentage
6.89%
-
-
Categories of Active Advertising
-
3.1.2 Minor contracts
-
Percentage
0.15%
-
-
Categories of Active Advertising
-
3.2.1 Partnership agreements
-
Percentage
1.03%
-
-
Categories of Active Advertising
-
3.2.2 Management assignments
-
Percentage
0.43%
-
-
Categories of Active Advertising
-
3.3.1 Subsidies and public aid granted
-
Percentage
3.33%
-
-
Categories of Active Advertising
-
3.4.1 Budgets
-
Percentage
2.63%
-
-
Categories of Active Advertising
-
3.4.2 Specific costs
-
Percentage
4.90%
-
-
Categories of Active Advertising
-
3.4.3 Financial and accounting control systems
-
Percentage
0.18%
-
-
Categories of Active Advertising
-
3.5.1 Remuneration of senior officials and top managers
-
Percentage
2.59%
-
-
Categories of Active Advertising
-
3.5.2 Good governance
-
Percentage
1.21%
-
-
Categories of Active Advertising
-
3.5.3 Employment relationships
-
Percentage
2.76%
-
-
Categories of Active Advertising
-
3.5.4 Remuneration of public employees
-
Percentage
3.80%
-
-
Categories of Active Advertising
-
3.5.5 Authorization or Recognition of Compatibility Decisions Affecting Public Employees
-
Percentage
0.42%
-
-
Categories of Active Advertising
-
3.6.1 Statistics activity
-
Percentage
7.17%
-
-
Categories of Active Advertising
-
3.7.1 Real property and real rights
-
Percentage
1.08%
-
-
Categories of Active Advertising
-
4 Other information
-
Percentage
32.04%
-
-
Categories of Active Advertising
-
TOTAL
-
Percentage
100%
-
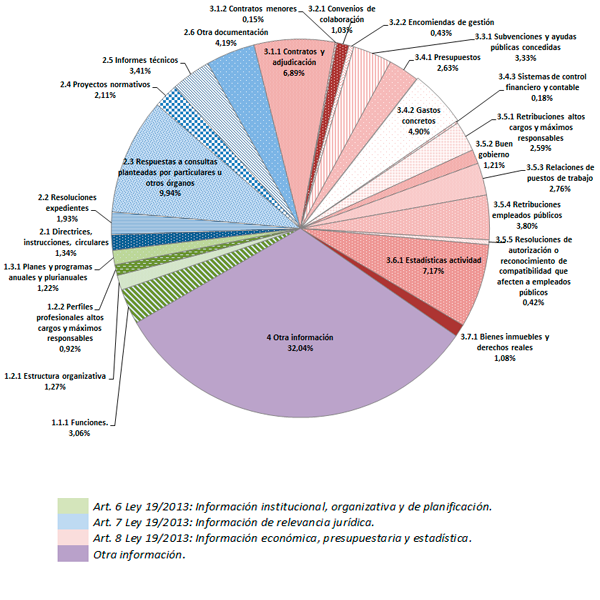
It shows the classification of applications for the right of access to public information in accordance with the obligations on active advertising established in articles 6 to 8 of Law 19/2013, of 9 December, on transparency, access to information and good governance, in order to complement the classification established in the previous point.
Data as of December 31, 2017. Source: GESAT (application for access request management)
Right of access: data of claims before the Council of Transparency and Good Governance (CTBG)
How much is claimed?
| Total requests Transparency Portal (as of 31/08/2017) | 10.129 | 100.00 % |
|---|---|---|
|
Unclaimed applications |
9.285 |
91.67 % |
|
Estimated claims by the CTBG |
364 |
3.59 % |
|
Claims dismissed by the CTBG |
369 |
3.64 % |
|
Claims inadmissible by the CTBG |
84 |
0.83 % |
|
Other forms of termination of claims by the CTBG |
27 |
0.27 % |
-
Total requests Transparency Portal (as of 31/08/2017)
-
Unclaimed applications
-
10.129
9.285
-
100.00 %
91.67 %
-
-
Total requests Transparency Portal (as of 31/08/2017)
-
Estimated claims by the CTBG
-
10.129
364
-
100.00 %
3.59 %
-
-
Total requests Transparency Portal (as of 31/08/2017)
-
Claims dismissed by the CTBG
-
10.129
369
-
100.00 %
3.64 %
-
-
Total requests Transparency Portal (as of 31/08/2017)
-
Claims inadmissible by the CTBG
-
10.129
84
-
100.00 %
0.83 %
-
-
Total requests Transparency Portal (as of 31/08/2017)
-
Other forms of termination of claims by the CTBG
-
10.129
27
-
100.00 %
0.27 %
-
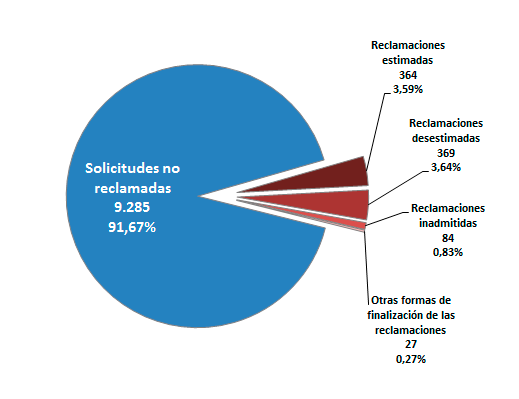
It shows those claims filed with the Council of Transparency and Good Governance (CTBG) against requests for information from the General Administration of the State processed through the Transparency Portal in accordance with the procedure established in Law 19/2013, of December 9.
Data as of August 31, 2017. Source: own elaboration based on the data provided by the CTBG. The statistical system of the CTBG has changed and the way of updating is being studied.